Available in Standard Set
Servers Performance Monitoringsince 0.3.0
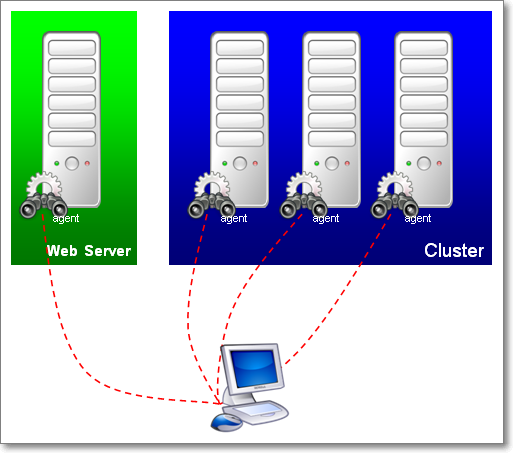
IntroductionDuring a load test, it is important to know the health of the servers loaded. It is also nice to see if you are targeting a cluster if the load is correctly dispatched. To address this, the plugin package now supports server monitoring! Using it, you can monitor CPU, Memory, Swap, Disks I/O and Networks I/O on almost all platforms! Here is how the plugin looks like. It shows the CPU usage of 4 servers involved in the load test:
Metrics collectedSince version 0.5.0 the Server Agent tool supports collecting over 75 system metrics. See full list. How it worksConceptJMeter cannot retrieve by default server metrics except Tomcat ones. To overcome this situation, we have developed a server agent which will get performance data for JMeter. The agent uses the SIGAR open source library. It is composed of a Java common part and native libraries per OS.
InstallationServer Agent tool detailed description is placed here. UsageGUI ModeIn GUI mode, just add the listener, define servers and metric types to monitor, ensure the agent is running at remote server and is not blocked by a firewall, then run the test. The values will be displayed at real time chart. Non GUI ModeIf you run JMeter in non GUI mode and want to save monitoring data to file, just configure result file saving in GUI as you do with other listeners. After running the test you may load saved file into GUI and see the values timeline. JMeter Properties
Seeing PerfMon Data OnlineThere is a feature on Loadosophia.org to see PerfMon collected data in a fancy Web interface. Here's an example. |
On this page:
|